Step 11: Making a Chart
To create a chart, choose one of these four menu commands in Reunion.

The SuperChart application is automatically opened when you choose one of the above in Reunion and click the Chart button in the window that appears.
SuperChart is an application designed to automatically draw, display, edit, and print graphic charts. SuperChart creates tree charts (descendant, pedigree, and relative charts) and timeline charts.
Tree Charts and Timelines
The tree charts handled by SuperChart include...
- descendant chart
- pedigree chart
- relative chart.
These charts have many elements in common. The contents of a tree chart depend on the type of chart, the number of generations, and of course, the entries and links in your Reunion family file.
Descendant charts start with a source couple and move forward in time.
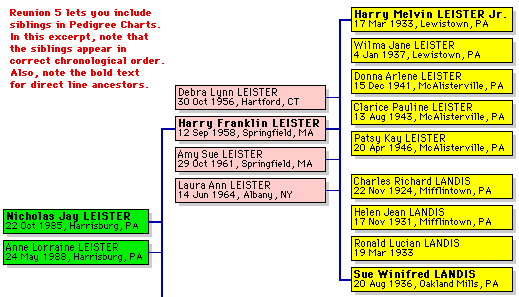
Pedigree charts start with a source person and move backward in time.

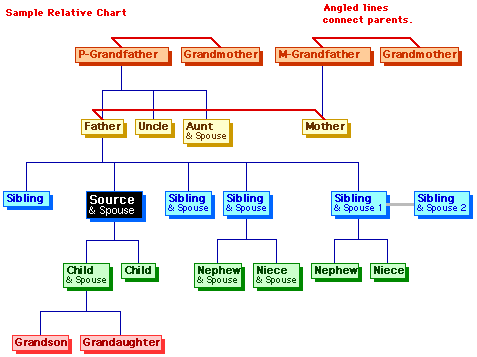
Relative charts move both directions, showing the blood relatives and spouses of a source person.

Timeline charts depict the lifespans of people as horizontal bars, similar to a Gantt chart. The fundamental element of a timeline chart is a bar. A bar is a rectangle whose length portrays the lifespan of a person. The beginning and end of the bar delineate the person's birth and death year. The person's name appears to the left of the bar.
In a timeline chart, the X axis shows a range of years. The Y axis has a list of people in the timeline chart. The collection of people included in a timeline chart is specified in Reunion's Timeline Chart window. After a timeline chart appears in SuperChart, you can edit the chart in many ways.

Both types of charts -- trees and timelines -- have many common elements and features. For example, you can add captions, frames, and pictures to both types of charts. In addition, the saving and printing processes are identical. Try double-clicking a box and changing some box attributes.
Previous Step / Table of Contents